NEW
Overview templates
KLA Corporation (KLAC)
Last Price$767.10.4%
Market Cap$101.9B
KLAC Rating
Crunching data... Almost there!
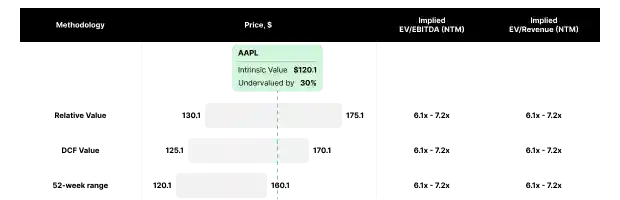
KLAC Intrinsic Value

KLAC Share Price History
1W 2.6%
1M 9.4%
6M (2.9%)
YTD 38.1%
1Y 18.4%
3Y 116.7%
5Y 363.6%
10Y 1,358.6%
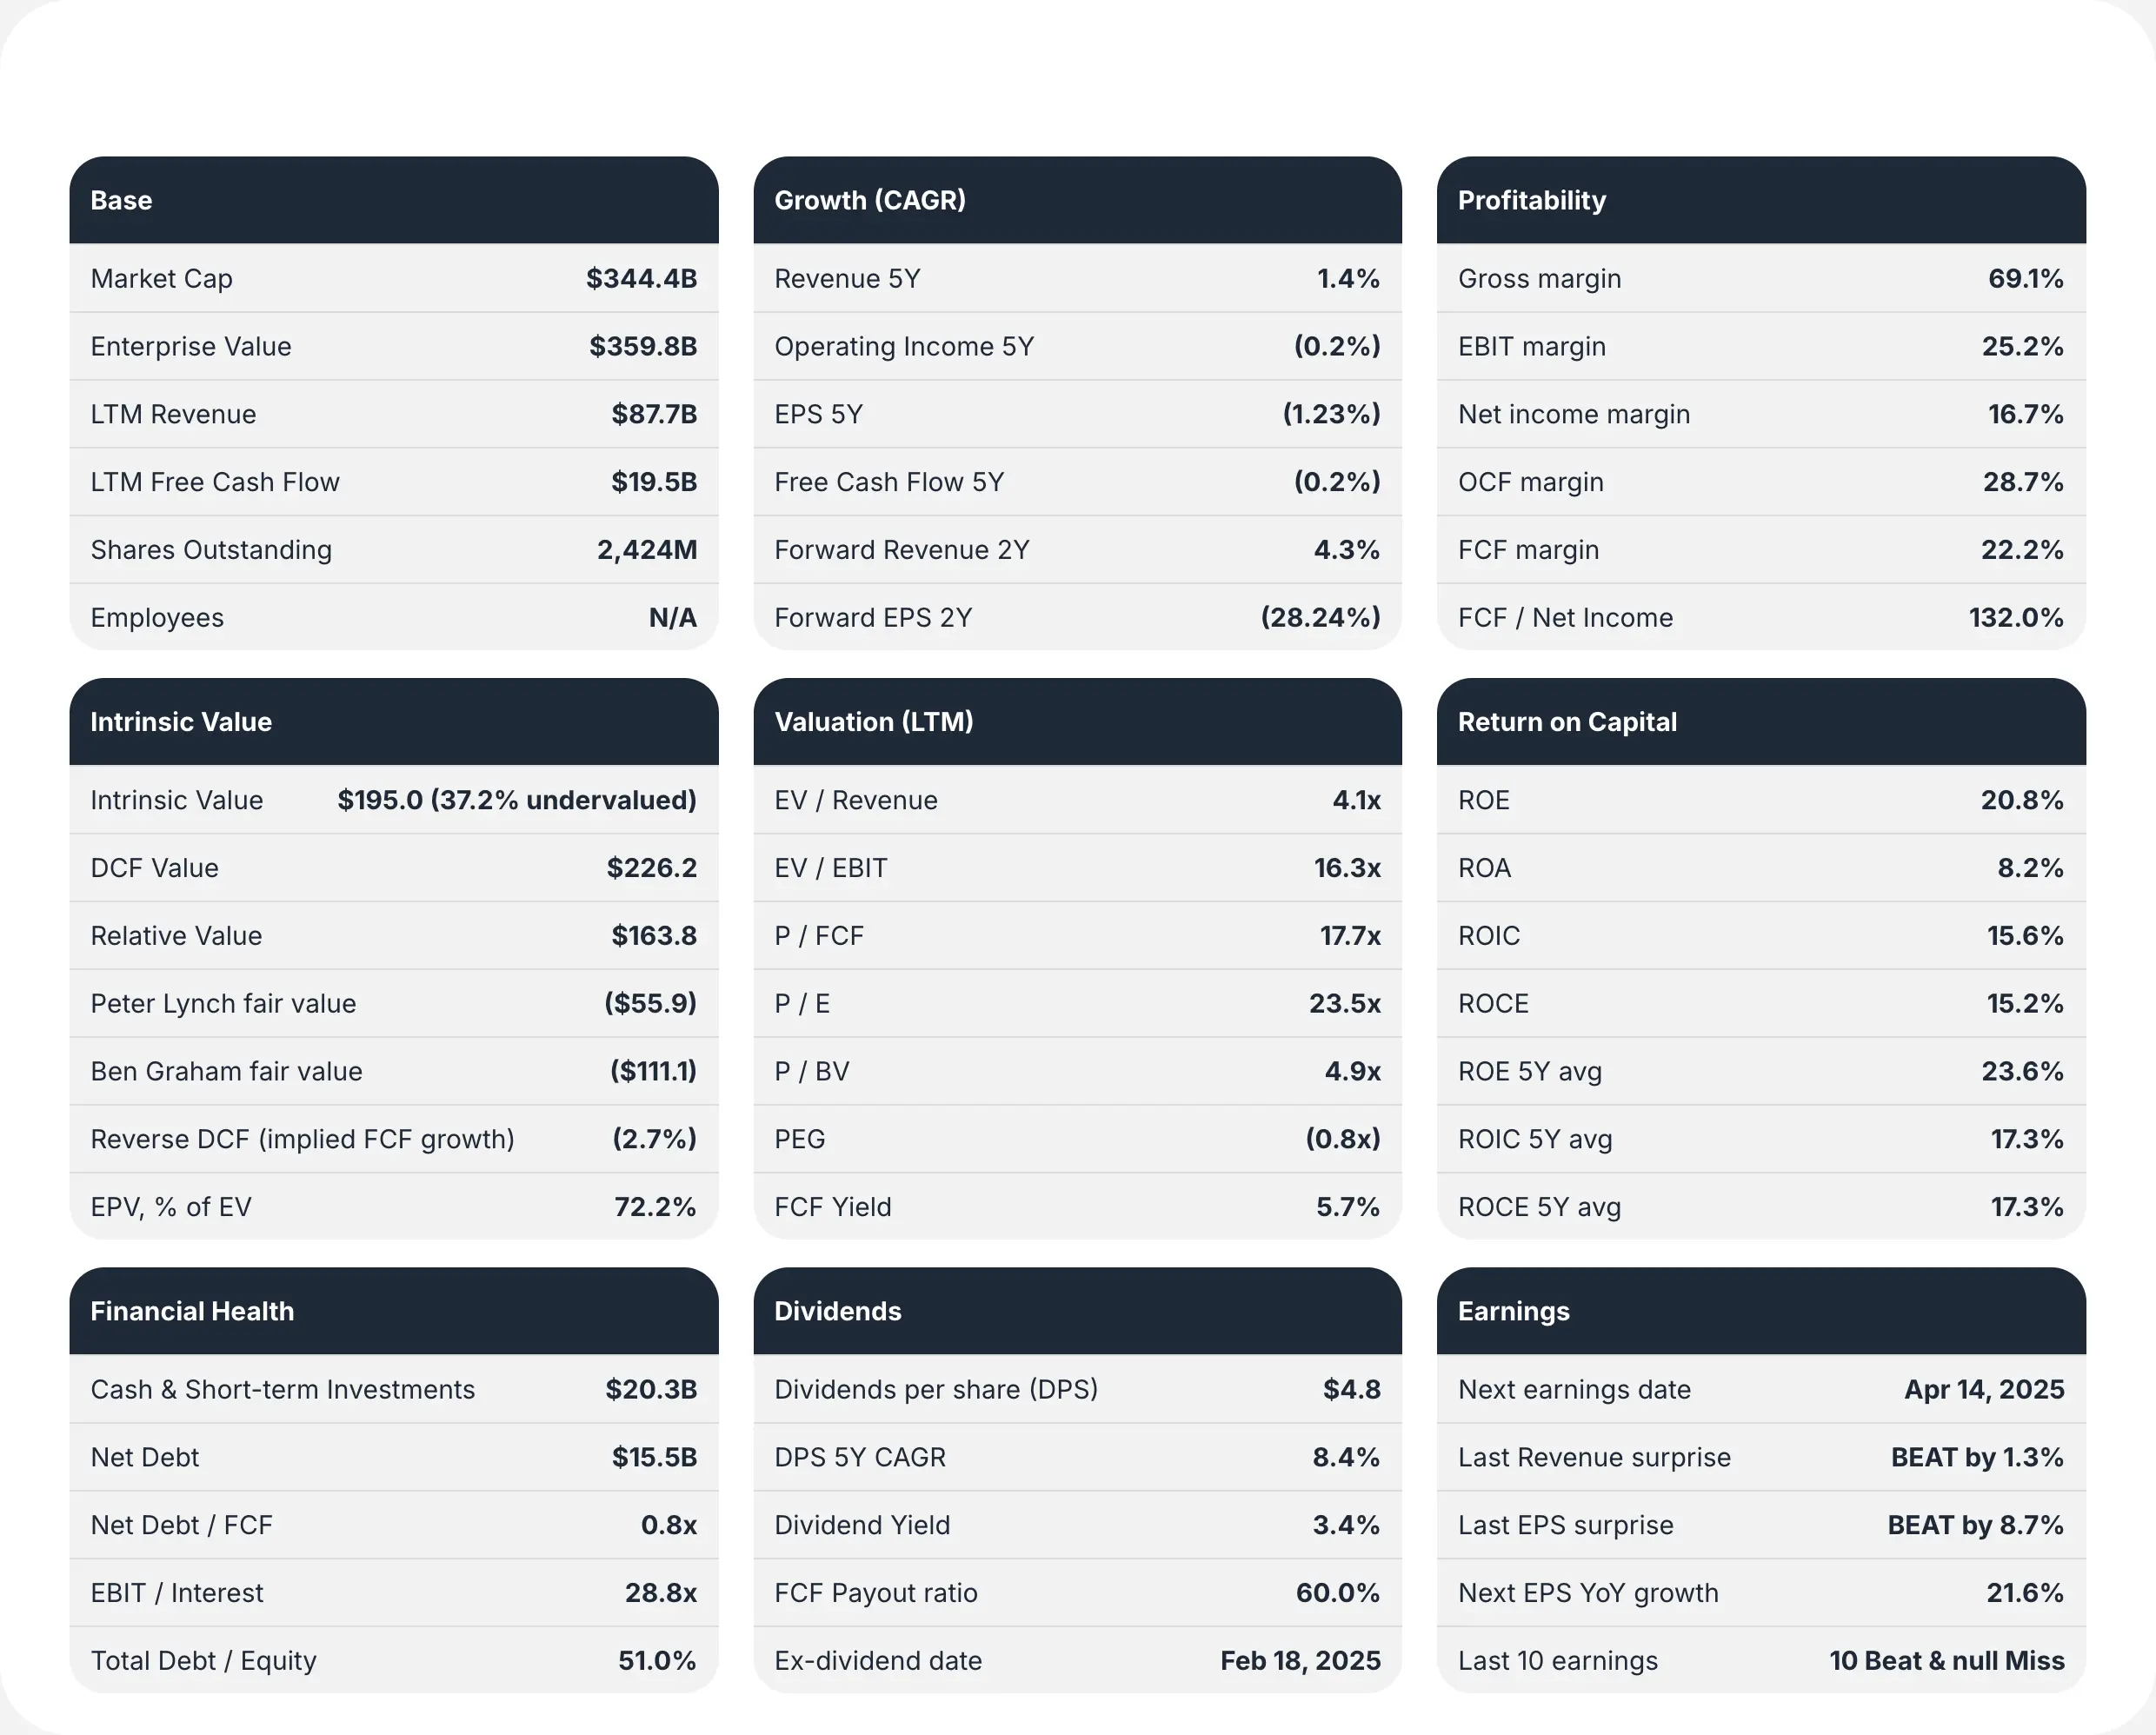
KLAC Stock Metrics
Key stats
Income statement
Balance sheet
Cash Flow Statement
Valuation
Ratios
Per share
Per employee
Dividends & Yields
KLAC Stock Financials
KLAC Income Statement Metrics
Crunching data... Almost there!
KLAC Cash Flow Statement Metrics
Crunching data... Almost there!
KLAC Income Statement Overview
Crunching data... Almost there!
KLAC Balance Sheet Overview
Crunching data... Almost there!
KLAC Stock Ratios
Annual
Quarterly
LTM
Industry Median
5Y Historical Average
Benchmark
Crunching data... Almost there!
Crunching data... Almost there!
Crunching data... Almost there!
Crunching data... Almost there!
Crunching data... Almost there!
Crunching data... Almost there!
Crunching data... Almost there!
Crunching data... Almost there!
KLAC Earnings Surprises
Crunching data... Almost there!
KLAC Dividends
KLAC Dividend Yield
Crunching data... Almost there!
KLAC Dividend Per Share
Crunching data... Almost there!
Competing with KLAC
Overview
Ratings
Valuation
Growth
Profitability
Health
Capital allocation
Momentum
Earnings
Dividends
Crunching data... Almost there!
FAQ
What is KLA Corporation (KLAC) stock rating?
As of today, KLA Corporation has a stock rating of 8 (out of 10), which is considered Great.
is KLA Corporation (KLAC) a good stock to buy?
As of today, KLA Corporation has a Great stock rating, which is 3.5% overvalued. According to Value Sense backtesting, stocks with similar profile tend to outperform the market by 0.5%.