Last Price$120.81.1%
Market Cap$18.6B
Strategy backtesting: Overvalued stocks with Good Quality rating
HISTORICAL INTRINSIC VALUE
This chart represents the performance of companies that meet the Intrinsic Value: Overvalued and Quality Rating: Good criteria. It shows the average for total return, total return over S&P500 and % of companies beating S&P500 over different timeframes
Total Return
Total Return over S&P500
% of companies beating S&P500
Average Total Return from Q1 2019 to Q4 2024
STLD Regression Analysis: Price Performance vs Valuation
LTM EV/Revenue Diff to 3M Hist Avg
3M Forward-looking Total return
0.67
LTM EV/Revenue Diff to 3M Hist Avg
3M Forward-looking Total return
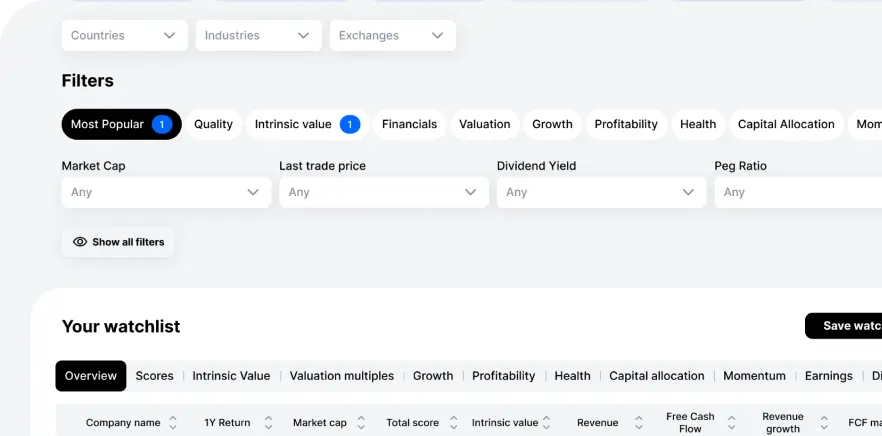
Stock screener for advanced investors
Find your perfect stocks and keep an eye on them

Value Sense Essentials

Compounding Quality

Heavy Moat

Low P/E High ROIC
More