
Loved by
investors
worldwide
investors
worldwide
10K+
Investors
use our platform
#1
Top value investing hub
with all necessary tools
1K+
Experienced investors
in our community
4.9
Average rating across
all rating platforms
Best stock ideas on the market right now
Undervalued dividend stocks, low P/E, high ROIC, and more

Undervalued stocks right now
Discover the top 20 best undervalued stocks to buy for Mar 2025, listed on the Nasdaq or NYSE.
3M Return 32.1%
S&P Outperformance 19.1%
Next 3M Predicted Return 20.3%

Low P/E stocks
Explore the best low P/E stocks to buy in 2025, featuring top companies trading at low P/E ratios.
3M Return 7.5%
S&P Outperformance 5.5%
Next 3M Predicted Return 10.2%

Undervalued dividend stocks
Discover the top 20 best undervalued high-yield dividend stock that offers both growth potential and attractive dividend returns for Mar 2025.
3M Return 28.4%
S&P Outperformance 15.4%
Next 3M Predicted Return 16.9%
Stock Screener
Find your perfect stocks and keep an eye on them

Value Sense Essentials

Compounding Quality

Heavy Moat

Low P/E High ROIC
More

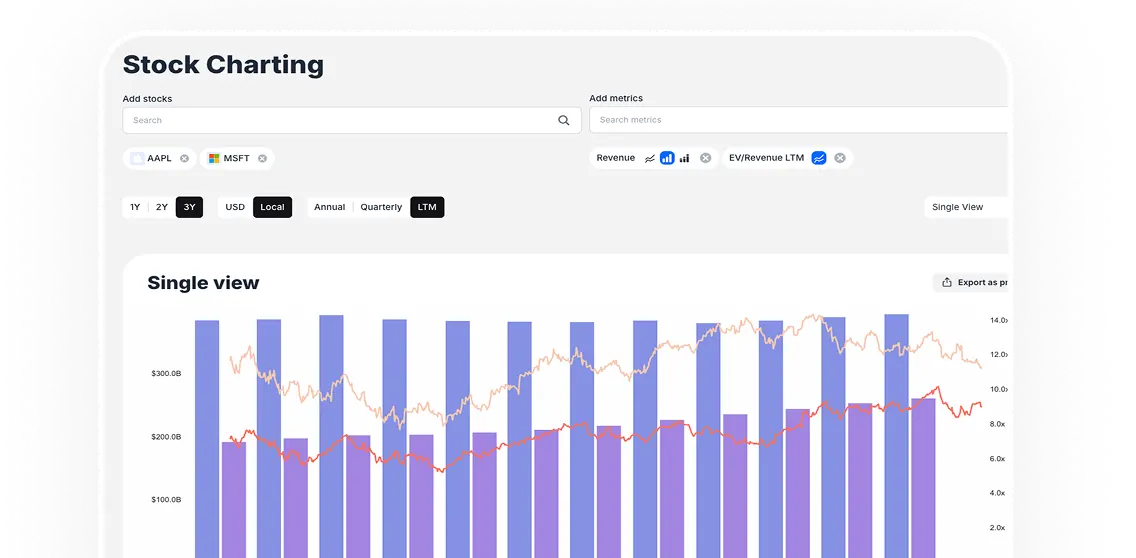
Stock charting
Free charing tool for professional financial data visualization.
Combine data
Build multiple charts
Explore stock charting
Intrinsic Value calculators
Undervalued stocks right now
Discover Hidden Gems in the Market
Overview
Ratings
Intrinsic Value
Valuation
Growth
Profitability
Health
Capital allocation
Momentum
Earnings
Dividends
Company name | Market Cap | Quality rating | Intrinsic value | 1Y Return | Revenue | Free Cash Flow | Revenue growth | FCF margin | Gross margin | ROIC | Total Debt to Equity |
$2,909.0B | 7.0 | $431.5 10.3% undervalued | (8.2%) | $261.8B | $70.0B | 15.0% | 26.7% | 69.4% | 27.5% | 20.6% | |
$916.5B | 8.4 | $332.6 88.2% undervalued | 27.7% | NT$2,894.3B | NT$894.9B | 33.9% | 30.9% | 56.1% | 29.1% | 22.8% | |
$479.1B | 6.0 | $641.9 24.2% undervalued | 6.8% | $396.6B | $20.7B | 7.9% | 5.2% | 21.6% | 17.9% | 75.0% | |
$438.2B | 6.5 | $182.5 19.9% undervalued | 19.3% | $55.8B | $5,812.0M | 6.2% | 10.4% | 69.8% | 15.5% | 557.8% | |
$393.8B | 6.0 | $196.9 20.3% undervalued | 8.4% | $88.8B | $18.1B | 4.3% | 20.3% | 69.1% | 15.7% | 51.2% | |
$370.7B | 6.0 | $301.2 43.4% undervalued | 22.6% | $56.3B | $17.8B | 3.7% | 31.7% | 73.6% | 8.3% | 1,996.0% | |
$317.5B | 6.3 | $277.1 1.7% undervalued | 41.2% | €34.2B | €4,423.0M | 9.5% | 12.9% | 73.0% | 9.0% | 23.3% |
Explore stock ideas

Low P/E stocks
Explore the best low P/E stocks to buy in 2024, featuring top companies trading at low P/E ratios.

Companies with low debt
Discover top companies with low debt to equity ratios, highlighting those with strong financial stability and reduced bankruptcy risk.

High ROIC stocks
Discover high ROIC stocks in 2024 that generate returns on invested capital, driving sustainable growth and profitability. 50 stocks


Today's Market Movers
Top gainers
| Company name | Last price | Intrinsic value |
$0.2 37.8% | $1.1 417.9% undervalued | |
$11.1 31.9% | $15.9 43.7% undervalued | |
$58.6 30.3% | $0.6 99.0% overvalued | |
$14.3 23.6% | $14.6 2.0% undervalued | |
$8.3 19.2% | $7.2 13.5% overvalued | |
$4.9 13.7% | $0.1 97.2% overvalued | |
$21.2 12.9% | $29.4 38.4% undervalued | |
$283.3 11.7% | $86.2 69.6% overvalued | |
$5.3 11.7% | $2.4 53.8% overvalued | |
$2.5 11.5% | $5.2 103.8% undervalued |
Top loosers
| Company name | Last price | Intrinsic value |
$0.7 29.0% | $0.7 8.8% undervalued | |
$5.8 17.8% | $7.2 23.6% undervalued | |
$1.1 14.0% | $1.0 10.9% overvalued | |
$12.4 13.6% | $9.9 19.8% overvalued | |
$285.5 12.6% | $293.6 2.8% undervalued | |
$10.1 10.9% | $15.3 52.3% undervalued | |
$3.2 10.8% | $1.0 67.1% overvalued | |
$3.8 10.6% | $3.3 14.0% overvalued | |
$40.0 10.6% | $1.6 96.0% overvalued | |
$4.0 10.3% | $19.2 378.1% undervalued |
Value Sense blog
More insights & guides
Crunching data... Almost there!
Market summary
Get a comprehensive overview of today’s market performance & major shifts
Crunching data... Almost there!
Earnings calendar
Check out the most interesting companies expected to release earning reports
Clear all filters
24 - 28 March
mon
24
KBH
EPAC
LUNR
tue
25
MKC
GME
CNM
PHI
PRGS
WOR
ATAT
wed
26
CTAS
PAYX
DLTR
CHWY
RUM
RH
ALVO
FUL
CNXC
VRNT
MLKN
SCS
thu
27
SNX
WBA
MSM
BRZE
CNTA
AGX
MNPR
fri
28
SBS